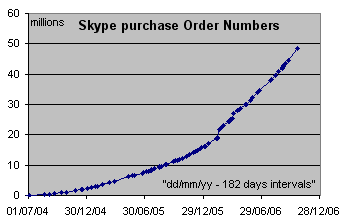
The graph below shows the sequential purchase order numbers of Skype. In the 3 first quarters about 29.5 million orders were generated. This means (after a correction of 5 million for “strange jumps”, see below) a mean value per purchase order of 5.3 US$.
 I guess (from the graph) that about 15 million new orders will be generated in the fourth quarter, what could correspond to 80 million US$ revenue. The yearly net revenue of Skype should therefore be around 210 million US$ by the end of the year.
Some comments on the orders:
- Order numbers concern real purchases like SkypeOut minutes, SkypeIn subscriptions, Skype Voicemail, etc.
- But also “no purchases” like vouchers, gifts (from Skype to some of its customers), allocations to Skype Group members*, cancelled or rejected purchases, balance expirations**, etc.
- There have been in Quarter One two strange “brutal” jumps of 3 million and 2 million purchases “at once” (slightly visible on the graph). This is probably due to spambots.
- Allocations to members of Skype Groups (with zero revenue) represent about 400 thousand purchase order numbers in the three first quarters. They also get a sequential number. You can find it when looking at the “Expenditure List” in your Administration Page of the Skype Account.
** when a Skype customer doesn’t place any SkypeOut calls during a period of 6 months his Skype credits are “erased”, being a net revenue for Skype.

No comments:
Post a Comment